China Top 10 Chemical Fertilizer Manufacturers

Choosing a Chemical Fertilizer manufacturer in China requires more than comparing prices. Buyers need to assess product range, production consistency, documentation, and delivery capacity. A bag of urea or NPK granules may look standard, yet nutrient analysis and handling quality matter in the field. Small differences can affect storage, application, and crop planning.

Historian of technology Vaclav Smil wrote, “The Haber-Bosch synthesis of ammonia from its elements was the most important invention of the twentieth century.” His observation highlights fertilizer’s broad role in modern food production. It does not mean every product or supplier is equally suitable. Local soil conditions, crop needs, and responsible application still matter.

This guide introduces ten notable Chinese manufacturers and the factors buyers can use to compare them. These include product portfolios, manufacturing scale, quality controls, export experience, and publicly available certifications. Company capabilities can change, and a published ranking cannot capture every buyer’s needs. That deserves a closer look. Before requesting a quotation, confirm current specifications, packaging options, delivery terms, and supporting documents directly with the supplier. A clear comparison is more useful than a bold claim. It can also reveal gaps in the available information. Those gaps should be treated as questions to verify, not as proof of poor performance.
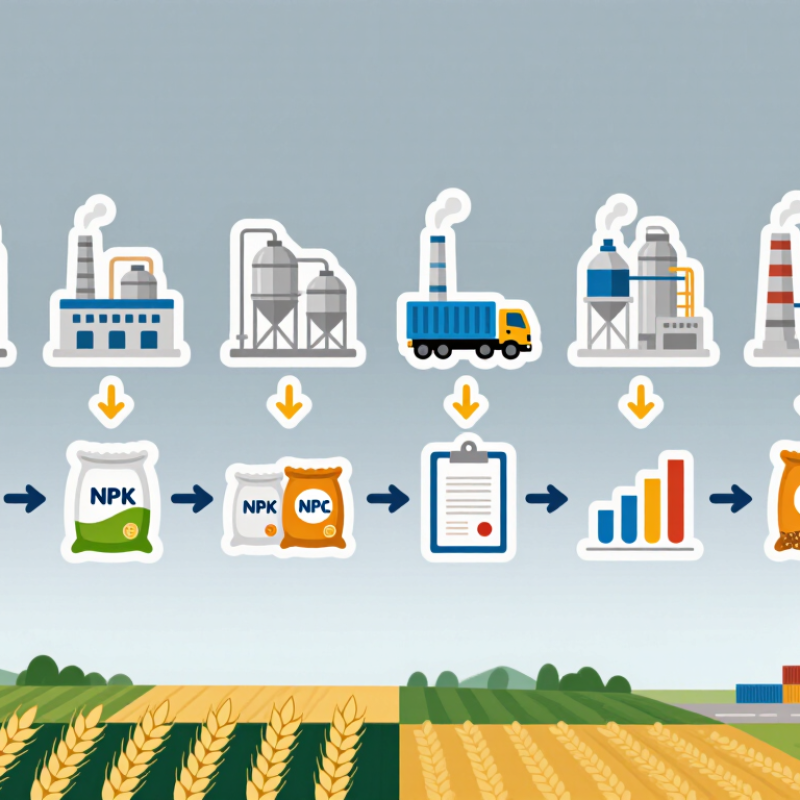
China Top 10 Chemical Fertilizer Manufacturers

Key Fertilizer Types and Market Segments in China

China’s fertilizer market is best understood by nutrient type and application. Nitrogen products, especially urea, support staple crops; phosphate fertilizers such as MAP and DAP supply phosphorus. Potash products help meet potassium needs, while compound NPK blends combine nutrients for specific soils and crops. Specialty formulations, including water-soluble fertilizers, serve higher-value horticulture. The mix matters.

The International Fertilizer Association’s 2024 short-term outlook estimated global fertilizer use at about 192.5 million tonnes of nutrients in 2023/24, underscoring the scale of demand behind national markets. China’s National Bureau of Statistics reported 695.41 million tonnes of grain output in 2023, a key context for its crop-focused fertilizer segment. Demand also varies by region: a grain grower’s bulk urea needs differ from a vegetable farm’s precise, frequent applications. These categories are useful, but imperfect; nutrient shares do not equal product sales, and local soil tests can change the right blend.

Criteria for Identifying Leading Manufacturers

When comparing China’s chemical fertilizer manufacturers, begin with product consistency, not production claims. Request recent batch analyses for nutrient content, moisture, particle size, and solubility. Compare results across several batches. One sample proves little. A clear quality system should connect incoming materials, production records, and finished-product checks.

Production capacity matters, but practical delivery matters more. Ask about monthly output, peak-season allocation, storage conditions, and typical lead times. If possible, review shipment records with sensitive details removed. A large facility can still struggle with scheduling. That distinction is easy to miss. Also examine technical support: can staff explain application rates, compatibility, and storage precautions in plain language?

Reliable manufacturers provide current product specifications, safety information, and traceable documentation. Check whether certificates match the facility and product under review; paperwork can be outdated. Environmental controls deserve attention too, including wastewater handling, dust collection, and energy use. Site visits or independent audits offer stronger evidence than promotional material, though access may be limited. No single score captures everything. Weigh verified quality, dependable delivery, transparent records, and responsive service against your intended crop, soil, and regional conditions. A few gaps may be manageable, but they should be documented rather than ignored.

China Top 10 Chemical Fertilizer Manufacturers - Criteria for Identifying Leading Manufacturers
No. Evaluation Criterion Evidence to Review What a Leading Manufacturer Demonstrates
1 Product-standard conformity Current product specifications, test reports, and conformity records against the applicable product standard. Examples include GB/T 15063-2020 for compound fertilizer and GB/T 2440-2017 for urea. Products consistently meet the applicable requirements for declared nutrient content and other specified quality characteristics.
2 Harmful-substance control Laboratory results and quality-control records relating to GB 38400-2019, which sets limits for toxic and harmful substances in fertilizers. Testing and controls are in place to verify compliance with applicable limits, with records traceable to products and production lots.
3 Accurate product labeling Packaging and label samples checked against applicable labeling rules, including GB 18382-2021, Fertilizer Marking—Content and Requirements. Labels provide the required product information clearly and consistently with product specifications and test records.
4 Regulatory and product-status management Relevant product registration, filing, or other regulatory documentation, as applicable to the product and its regulatory category. The manufacturer can show that its products are marketed with the required regulatory documentation and that records are kept current.
5 Quality-management and testing capability Documented inspection procedures, calibrated equipment records, batch test results, nonconformity handling, and relevant third-party test reports. Quality checks are integrated into production, and deviations are investigated and addressed with documented corrective actions.
6 Raw-material sourcing and traceability Supplier qualification records, incoming-material inspections, purchase records, and links between raw-material lots and finished-product batches. Key inputs and finished products can be traced through documented records, supporting consistent quality and timely investigation of issues.
7 Production consistency and process control Production procedures, equipment-maintenance records, process-monitoring data, and batch-to-batch quality results. The manufacturer controls critical production steps and can show stable results across repeated production batches.
8 Environmental compliance Applicable environmental approvals and permits, pollutant-monitoring records, and waste-management documentation for the facility. Operations are supported by the environmental documentation required for the facility and by records showing ongoing environmental management.
9 Occupational and process safety Risk assessments, staff training records, emergency-response plans, equipment inspections, and any permits required for the facility’s activities. Safety responsibilities and procedures are documented, employees are trained, and relevant risks are reviewed and managed.
10 Supply reliability and customer support Evidence of production capacity, delivery performance, product availability, complaint handling, and technical or agronomic support processes. The manufacturer can substantiate its ability to serve customers reliably and respond to product or application questions; claims should be checked against records.
Assessment note: Apply the standards and regulatory requirements relevant to each fertilizer type and facility. Verify documents with current official or accredited sources; this criteria table does not constitute a company ranking.

The Top 10 Chemical Fertilizer Manufacturers in China

The top 10 chemical fertilizer manufacturers in China are not defined by one universal ranking. Lists can change depending on production capacity, product range, export experience, and quality controls. A large plant may offer steady supply, while a smaller producer may provide more specialized formulations. Buyers should compare measurable details, not rely on rank alone.

Useful checks include product specifications, batch testing procedures, packaging options, and delivery records. Ask for recent certificates and confirm that they match the product being quoted. Technical support matters too. Can the supplier explain nutrient content, storage needs, and suitable application rates clearly? Practical answers are a stronger signal than polished sales language. Details count.

A careful comparison should also consider consistency between batches and communication during shipping. Request samples where appropriate, review documentation, and clarify how complaints are handled. These steps take time, and no ranking is perfect. Even a well-known supplier can be a poor fit for a particular crop, region, or order size. In the end, the strongest choice is the manufacturer whose verified capabilities match the buyer’s needs.

China’s Chemical Fertilizer Industry: A Product-Level Snapshot

Nutrient content in common fertilizer grades relevant to the products made by major manufacturers in China

Values show the conventional guaranteed nutrient grades by weight: nitrogen (N), phosphate (P₂O₅), and potash (K₂O). Actual product specifications may vary. This product-level comparison does not rank or report data for individual companies.

Company Profiles: Products, Capacity, and Locations

A useful profile of China’s leading fertilizer manufacturers should compare products, operating capacity, and plant locations—not just sales claims. Nitrogen producers commonly make urea and ammonia, while phosphate-focused sites supply ammonium phosphate and related products. Compound-fertilizer plants blend nutrients for regional crop needs. Production clusters include Shandong and Henan for nitrogen and compound products, and Hubei, Yunnan, and Guizhou for phosphate. Potash operations are more closely tied to resource areas in Qinghai and Xinjiang. These are broad patterns, not a map of every company.

Capacity figures need context. IFA’s 2024 Medium-Term Fertilizer Outlook estimated global fertilizer demand at about 192.5 million tonnes of nutrients in 2023. That figure is not comparable with a factory’s annual product tonnage unless nutrient content is specified. Numbers need context. A ten-company comparison should state whether capacity is installed, operating, or planned, and identify the reporting year. It should also note whether sites have nearby rail, ports, or feedstock access, since these affect delivery and costs. Public profiles can still be incomplete: announced capacity may not reflect actual output, and facility-level data is not always independently verified. That caveat matters.

Industry Trends and International Market Presence

China’s fertilizer sector is responding to tighter attention to nutrient efficiency, production emissions, and changing crop needs. Manufacturers are investing in improved processes and developing products that deliver nutrients more precisely. This shift matters to overseas buyers, who increasingly assess consistency, technical documentation, and supply reliability alongside price. Details matter.

International demand varies by region. Importers in areas with large grain-growing operations may prioritize bulk nitrogen and phosphate products, while other markets seek blends suited to specific soils and crops. Port access, shipping costs, seasonal buying patterns, and local registration requirements can all affect a supplier’s competitiveness. A product that works well in one market may not fit another.

Export presence is therefore more than shipment volume. Buyers often examine quality-control records, packaging options, delivery schedules, and whether technical support is available after a sale. Chinese manufacturers can benefit from broad production capacity and established logistics links, but global trade remains sensitive to freight changes and input costs. The picture is not always tidy. Smaller buyers may also find that product customization takes longer than expected, an issue worth discussing before contracts are finalized.